Data visualisation
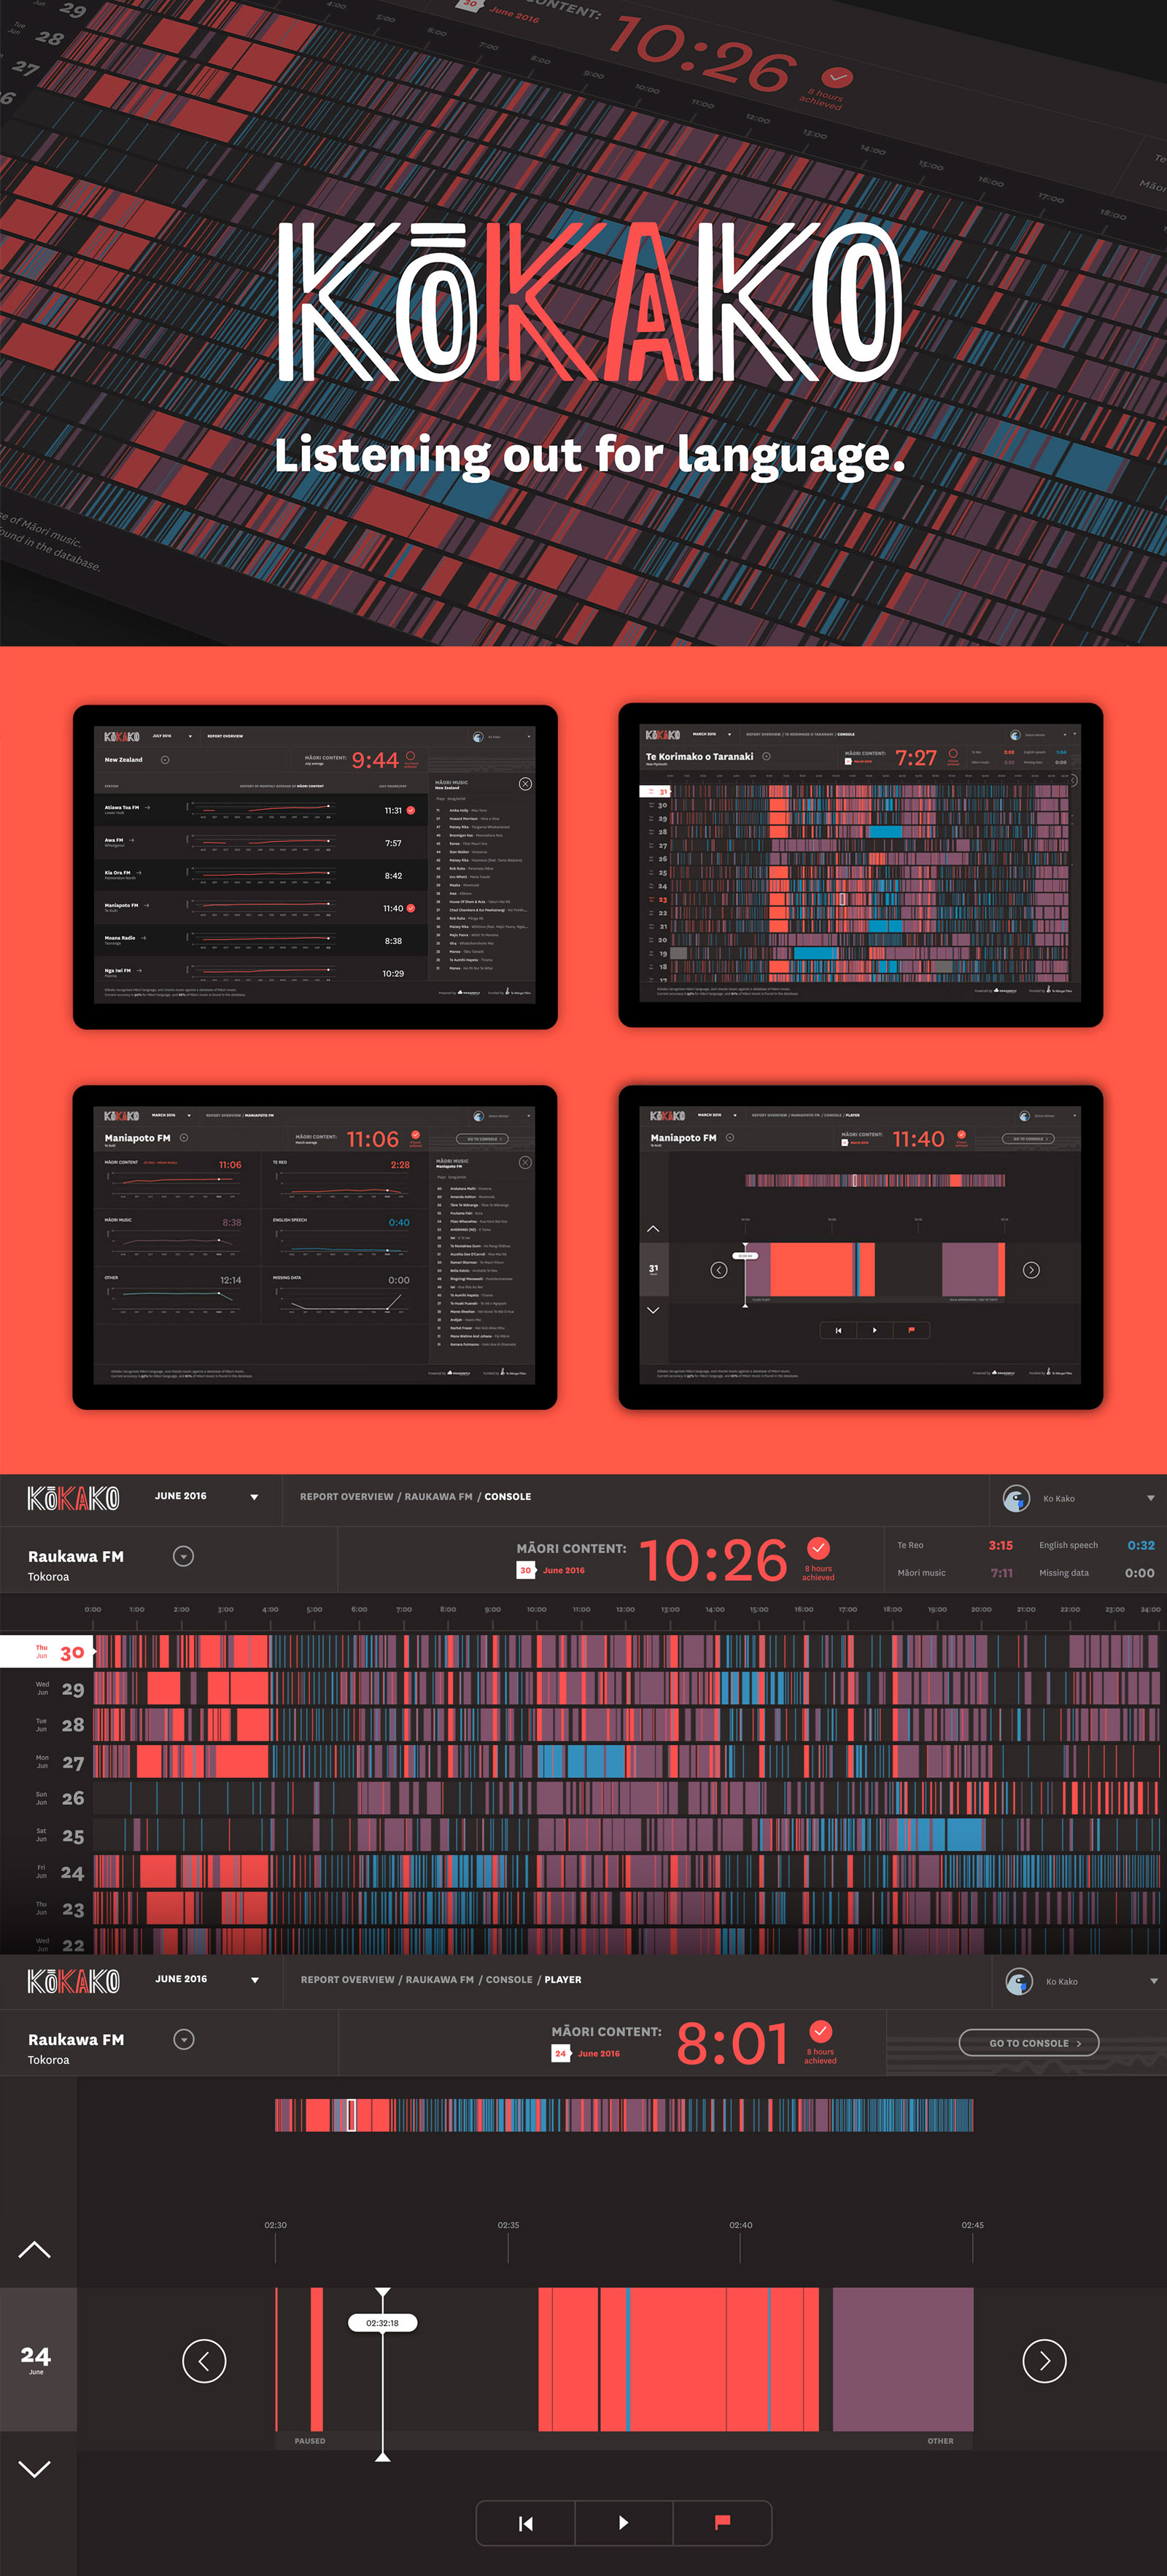
Kōkako language tracking app
Kōkako is a web application that was developed to measure the usage of Māori language across New Zealand radio. Using machine learning technology and a befitting design language , Kōkako has proven to be an elegant approach to helping preserve and promote the first language of Aotearoa.
This project has won the prestigious Purple Pin at the NZ Best Award for interactive design. Read the full case study here.
Client: Te Māngai Pāho
In partnership with Dragonfly Data Science.
↓
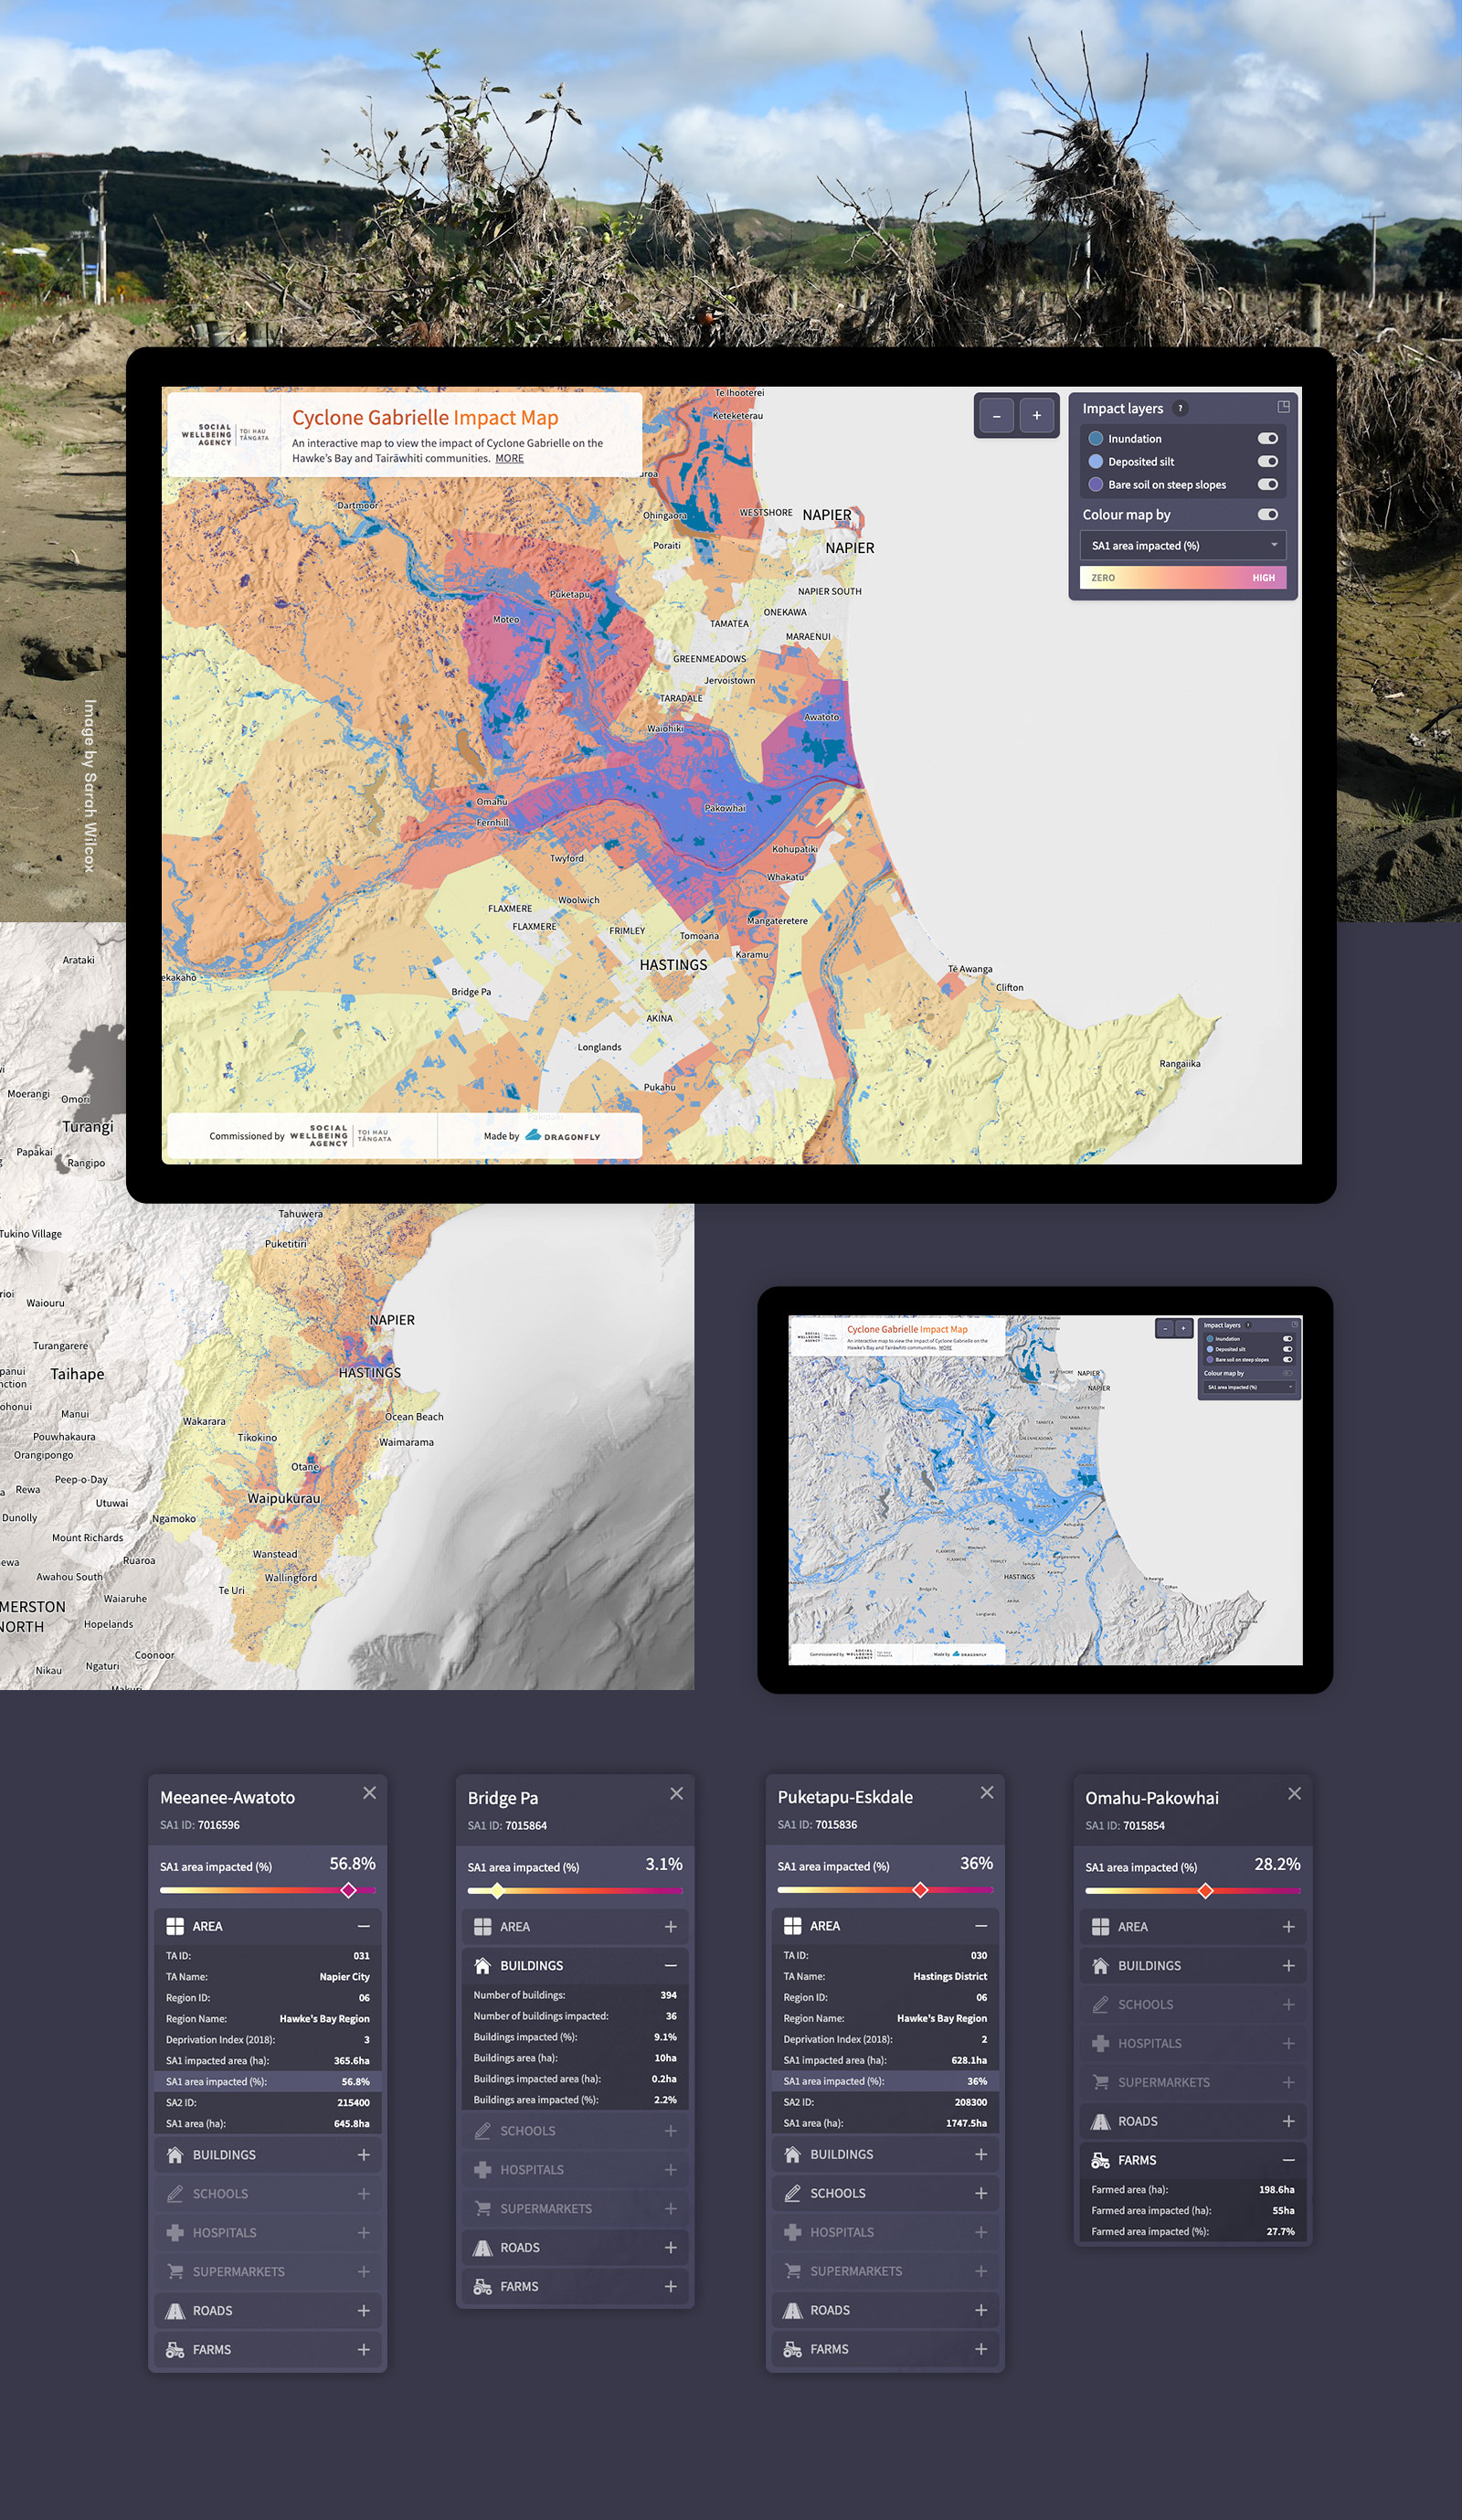
Cyclone Gabrielle impact map
High-resolution satellite imagery combined with demographic data was used to generate impact layers for this interactive map. This allows the user to see which communities in the Hawke’s Bay and Tairāwhiti regions were most severely impacted by Cyclone Gabriel between 12-15 February 2023.
Explore the map
Client: Social Wellbeing Agency
In partnership with Dragonfly Data Science.
↓
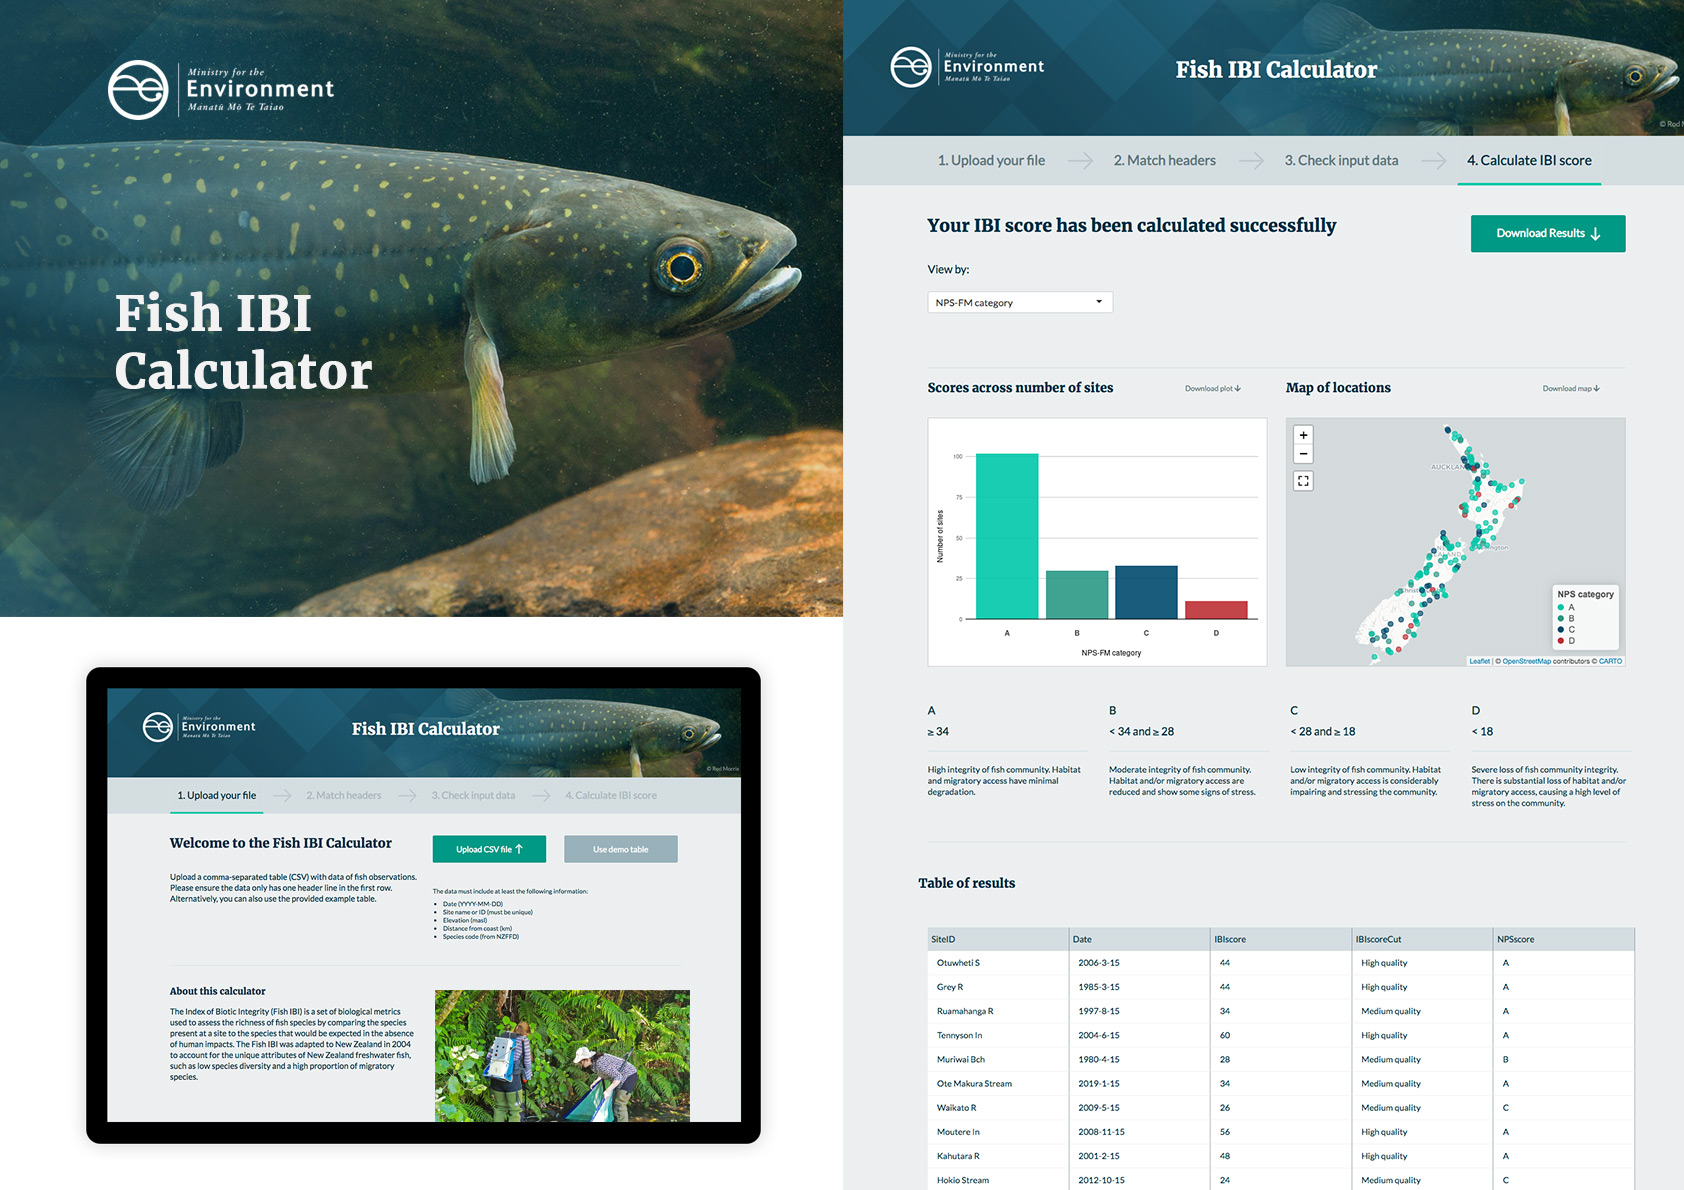
Fish IBI Calculator
The Index of Biotic Integrity (Fish IBI) is a set of biological metrics used to assess the richness of fish species by comparing the species present at a site to the species that would be expected in the absence of human impacts.
This calculator was developed to assist researchers in calculating Fish IBI scores by taking them through clear steps to align the uploaded data and providing an elegant report, following the brand guidelines of the Ministry of the Environment.
Client: Ministry for the Environment
In partnership with Dragonfly Data Science
↓
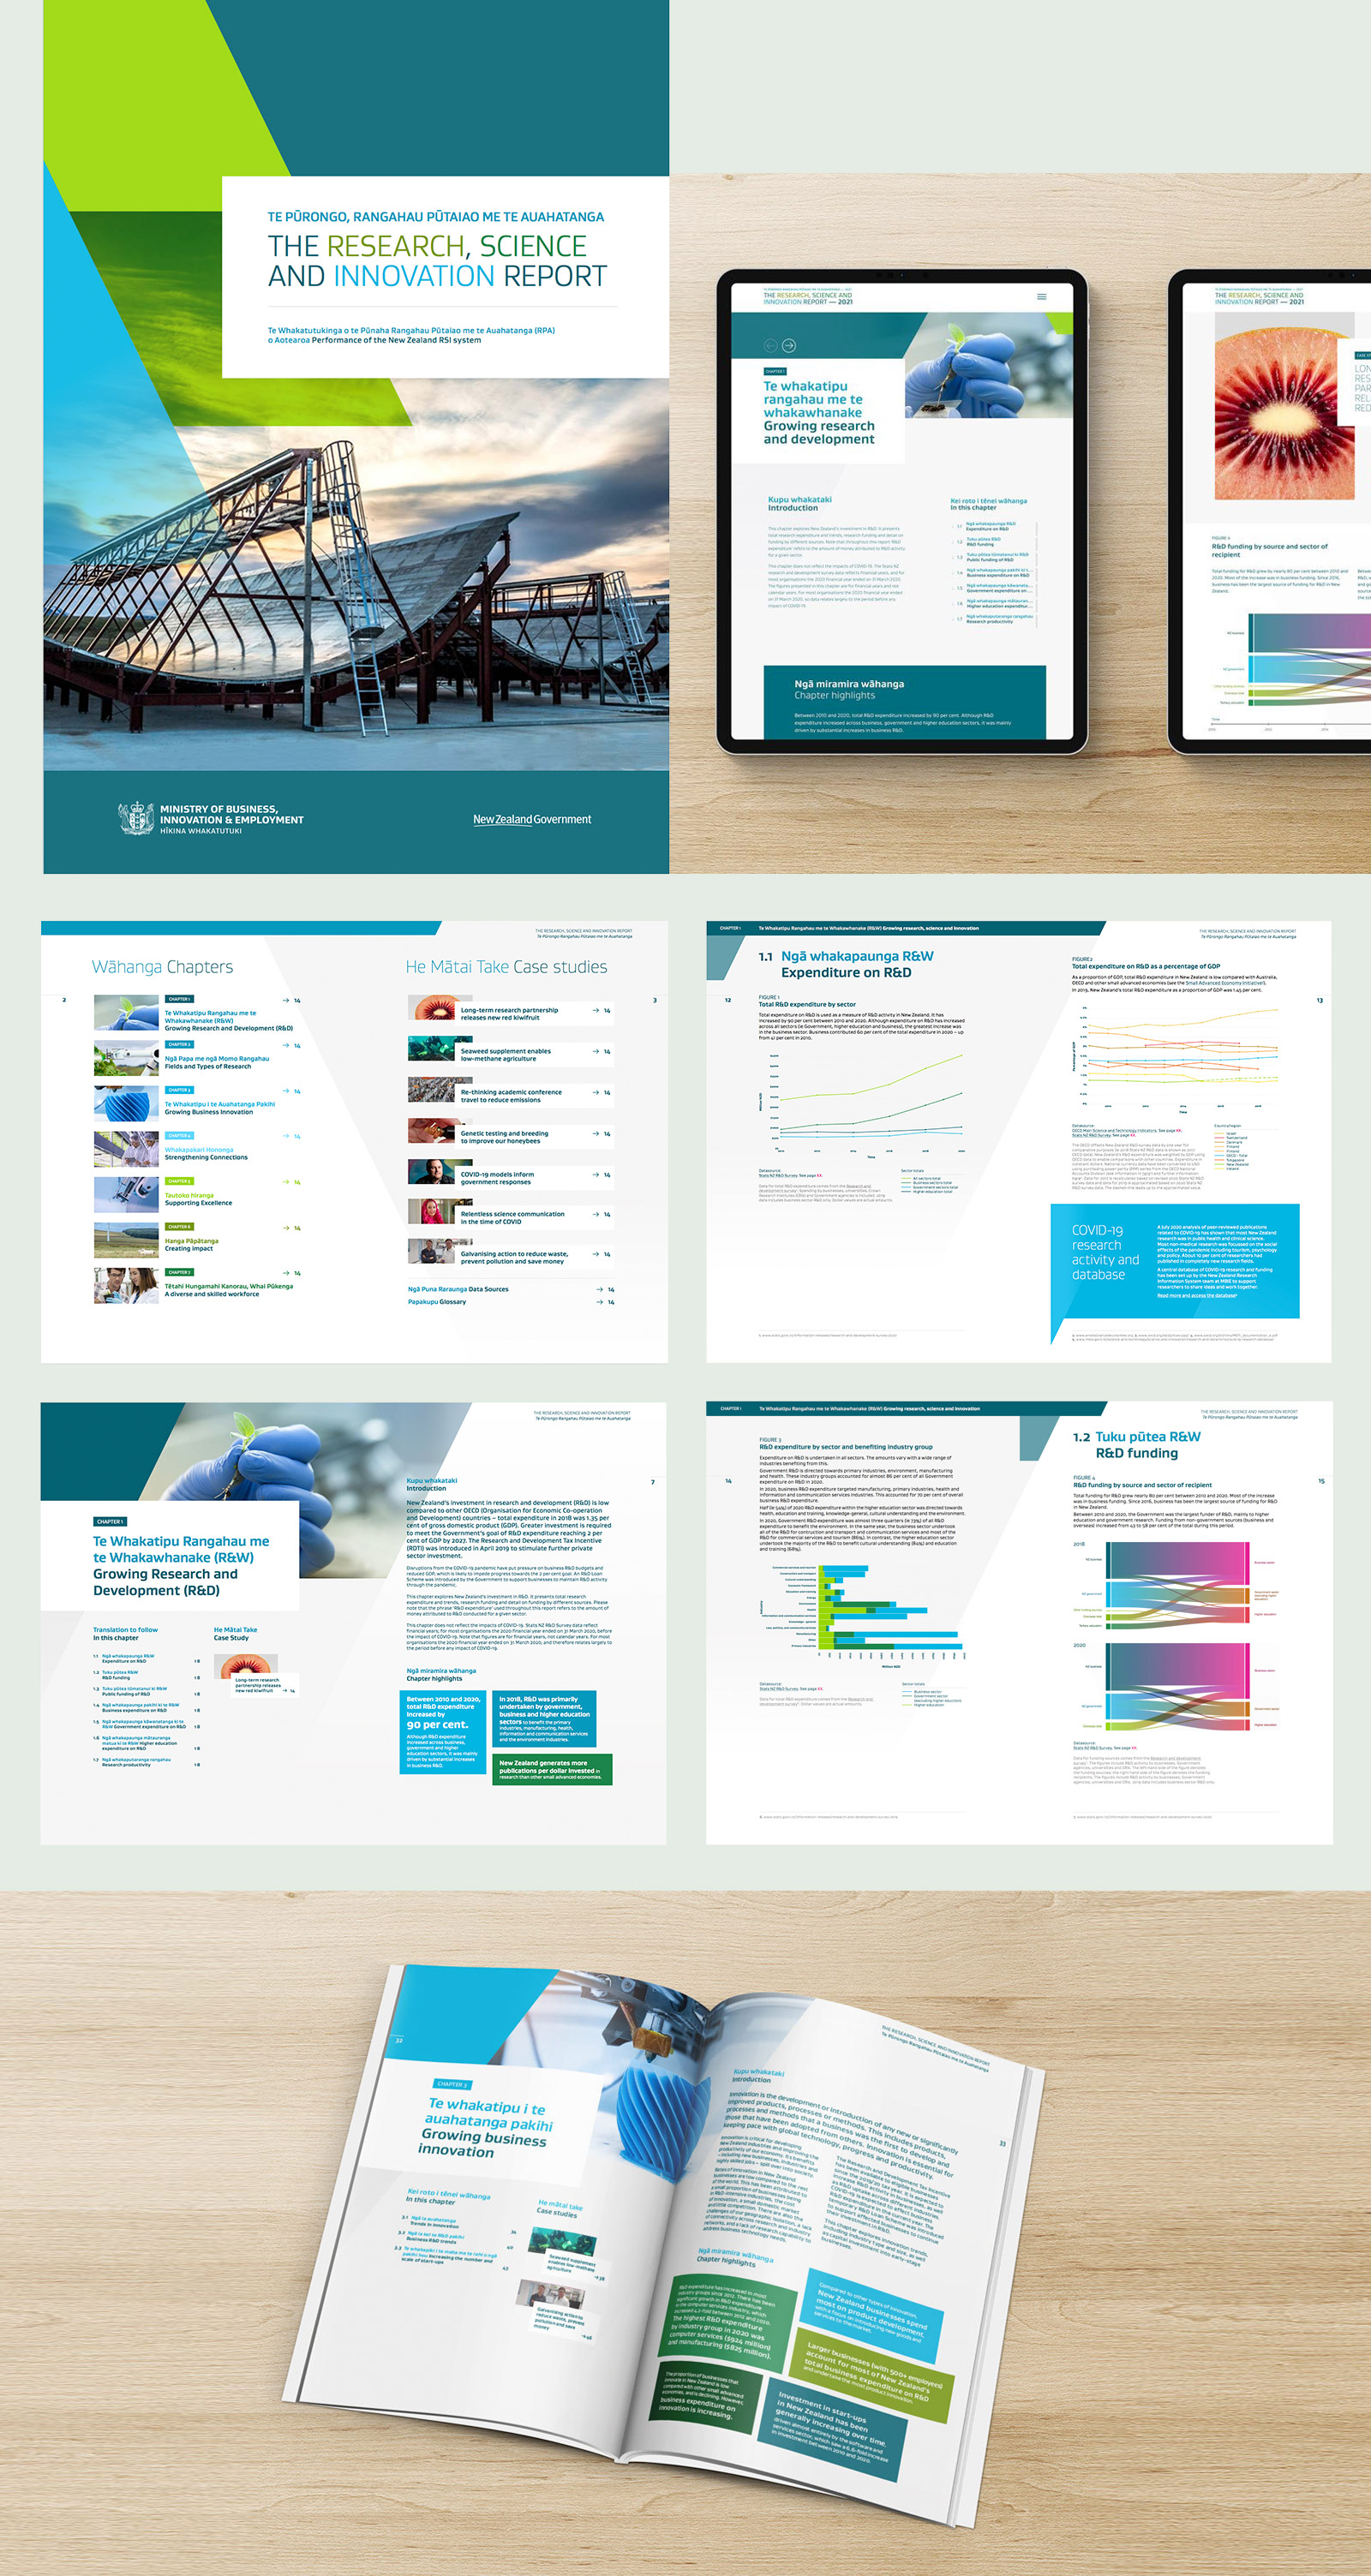
Research Science & Innovation Report
Client: Ministry of Business, Innovation and Employment
In partnership with Dragonfly Data Science
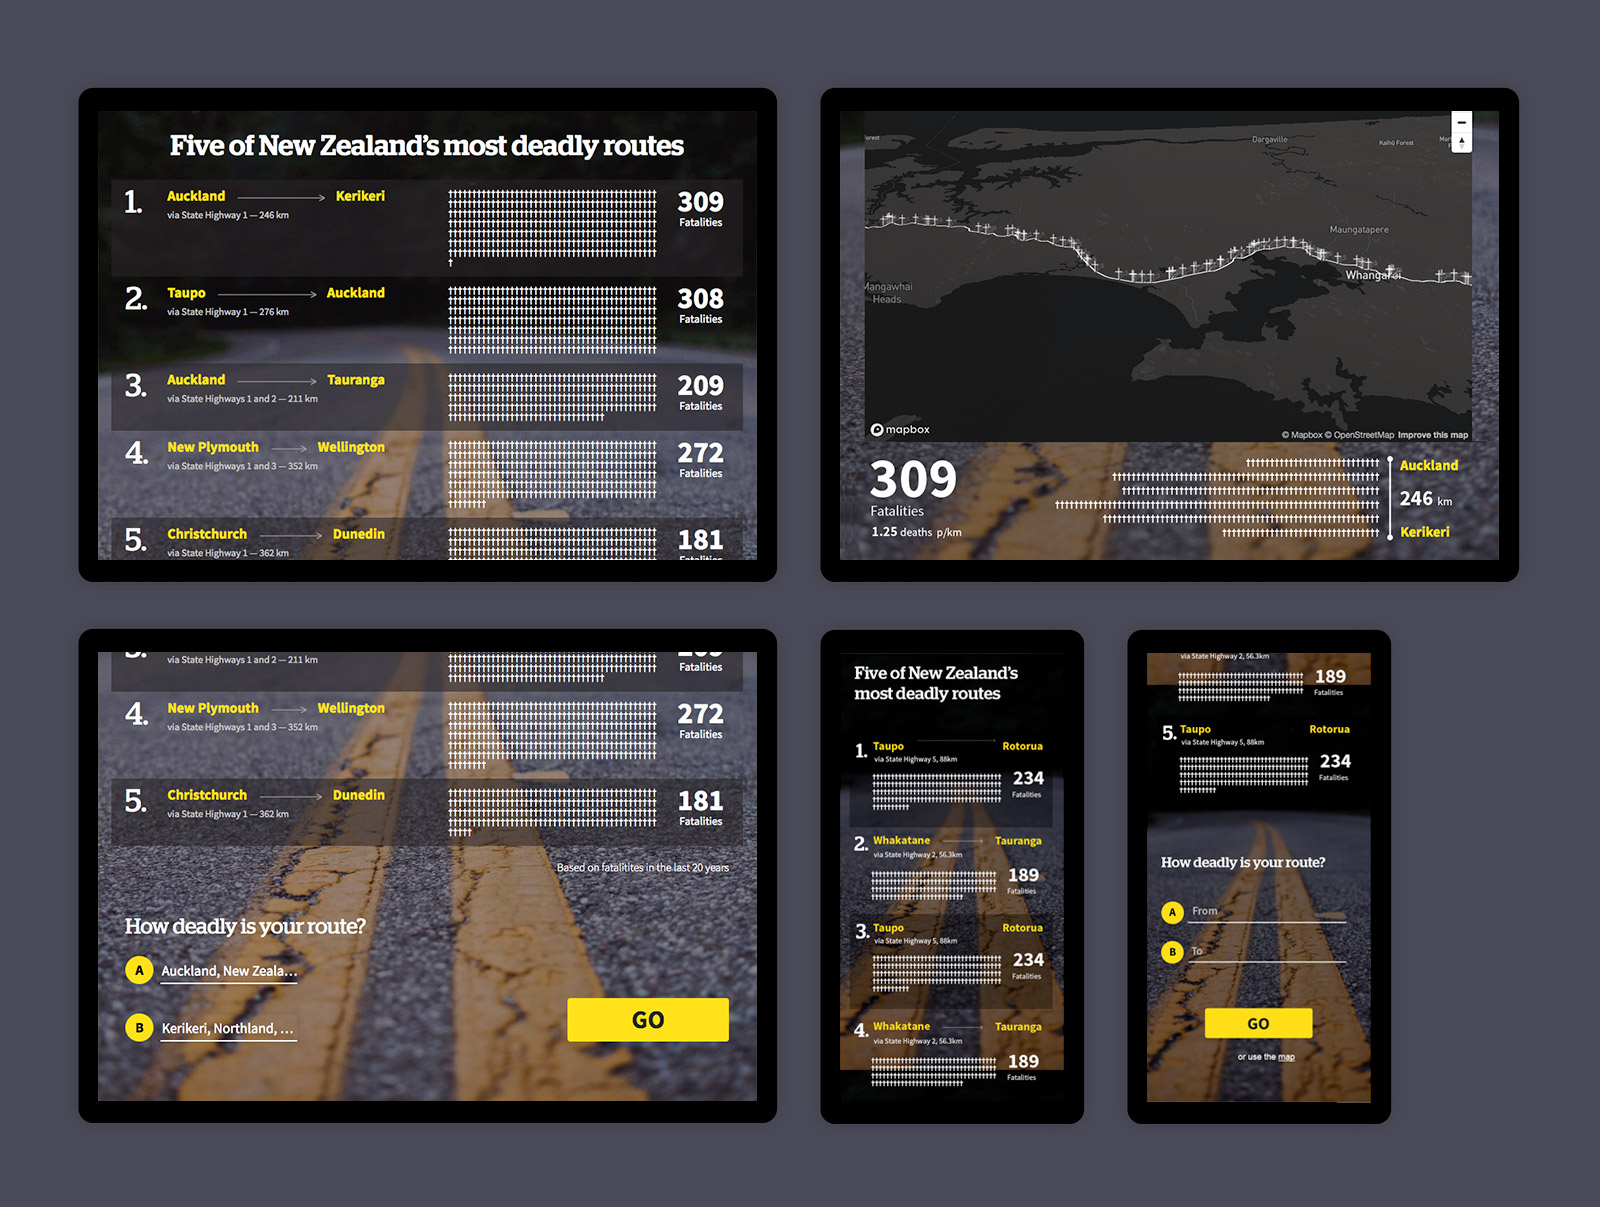
NZ Herald road toll infographic
Interactive infographic to raise awareness for safe driving during school holidays. After entering a start and end point of their journey, the system renders a dynamic map with their chosen route showing the fatalities along that route displayed as crosses.
Client: NZ Herald
Collaboration with Chris Knox
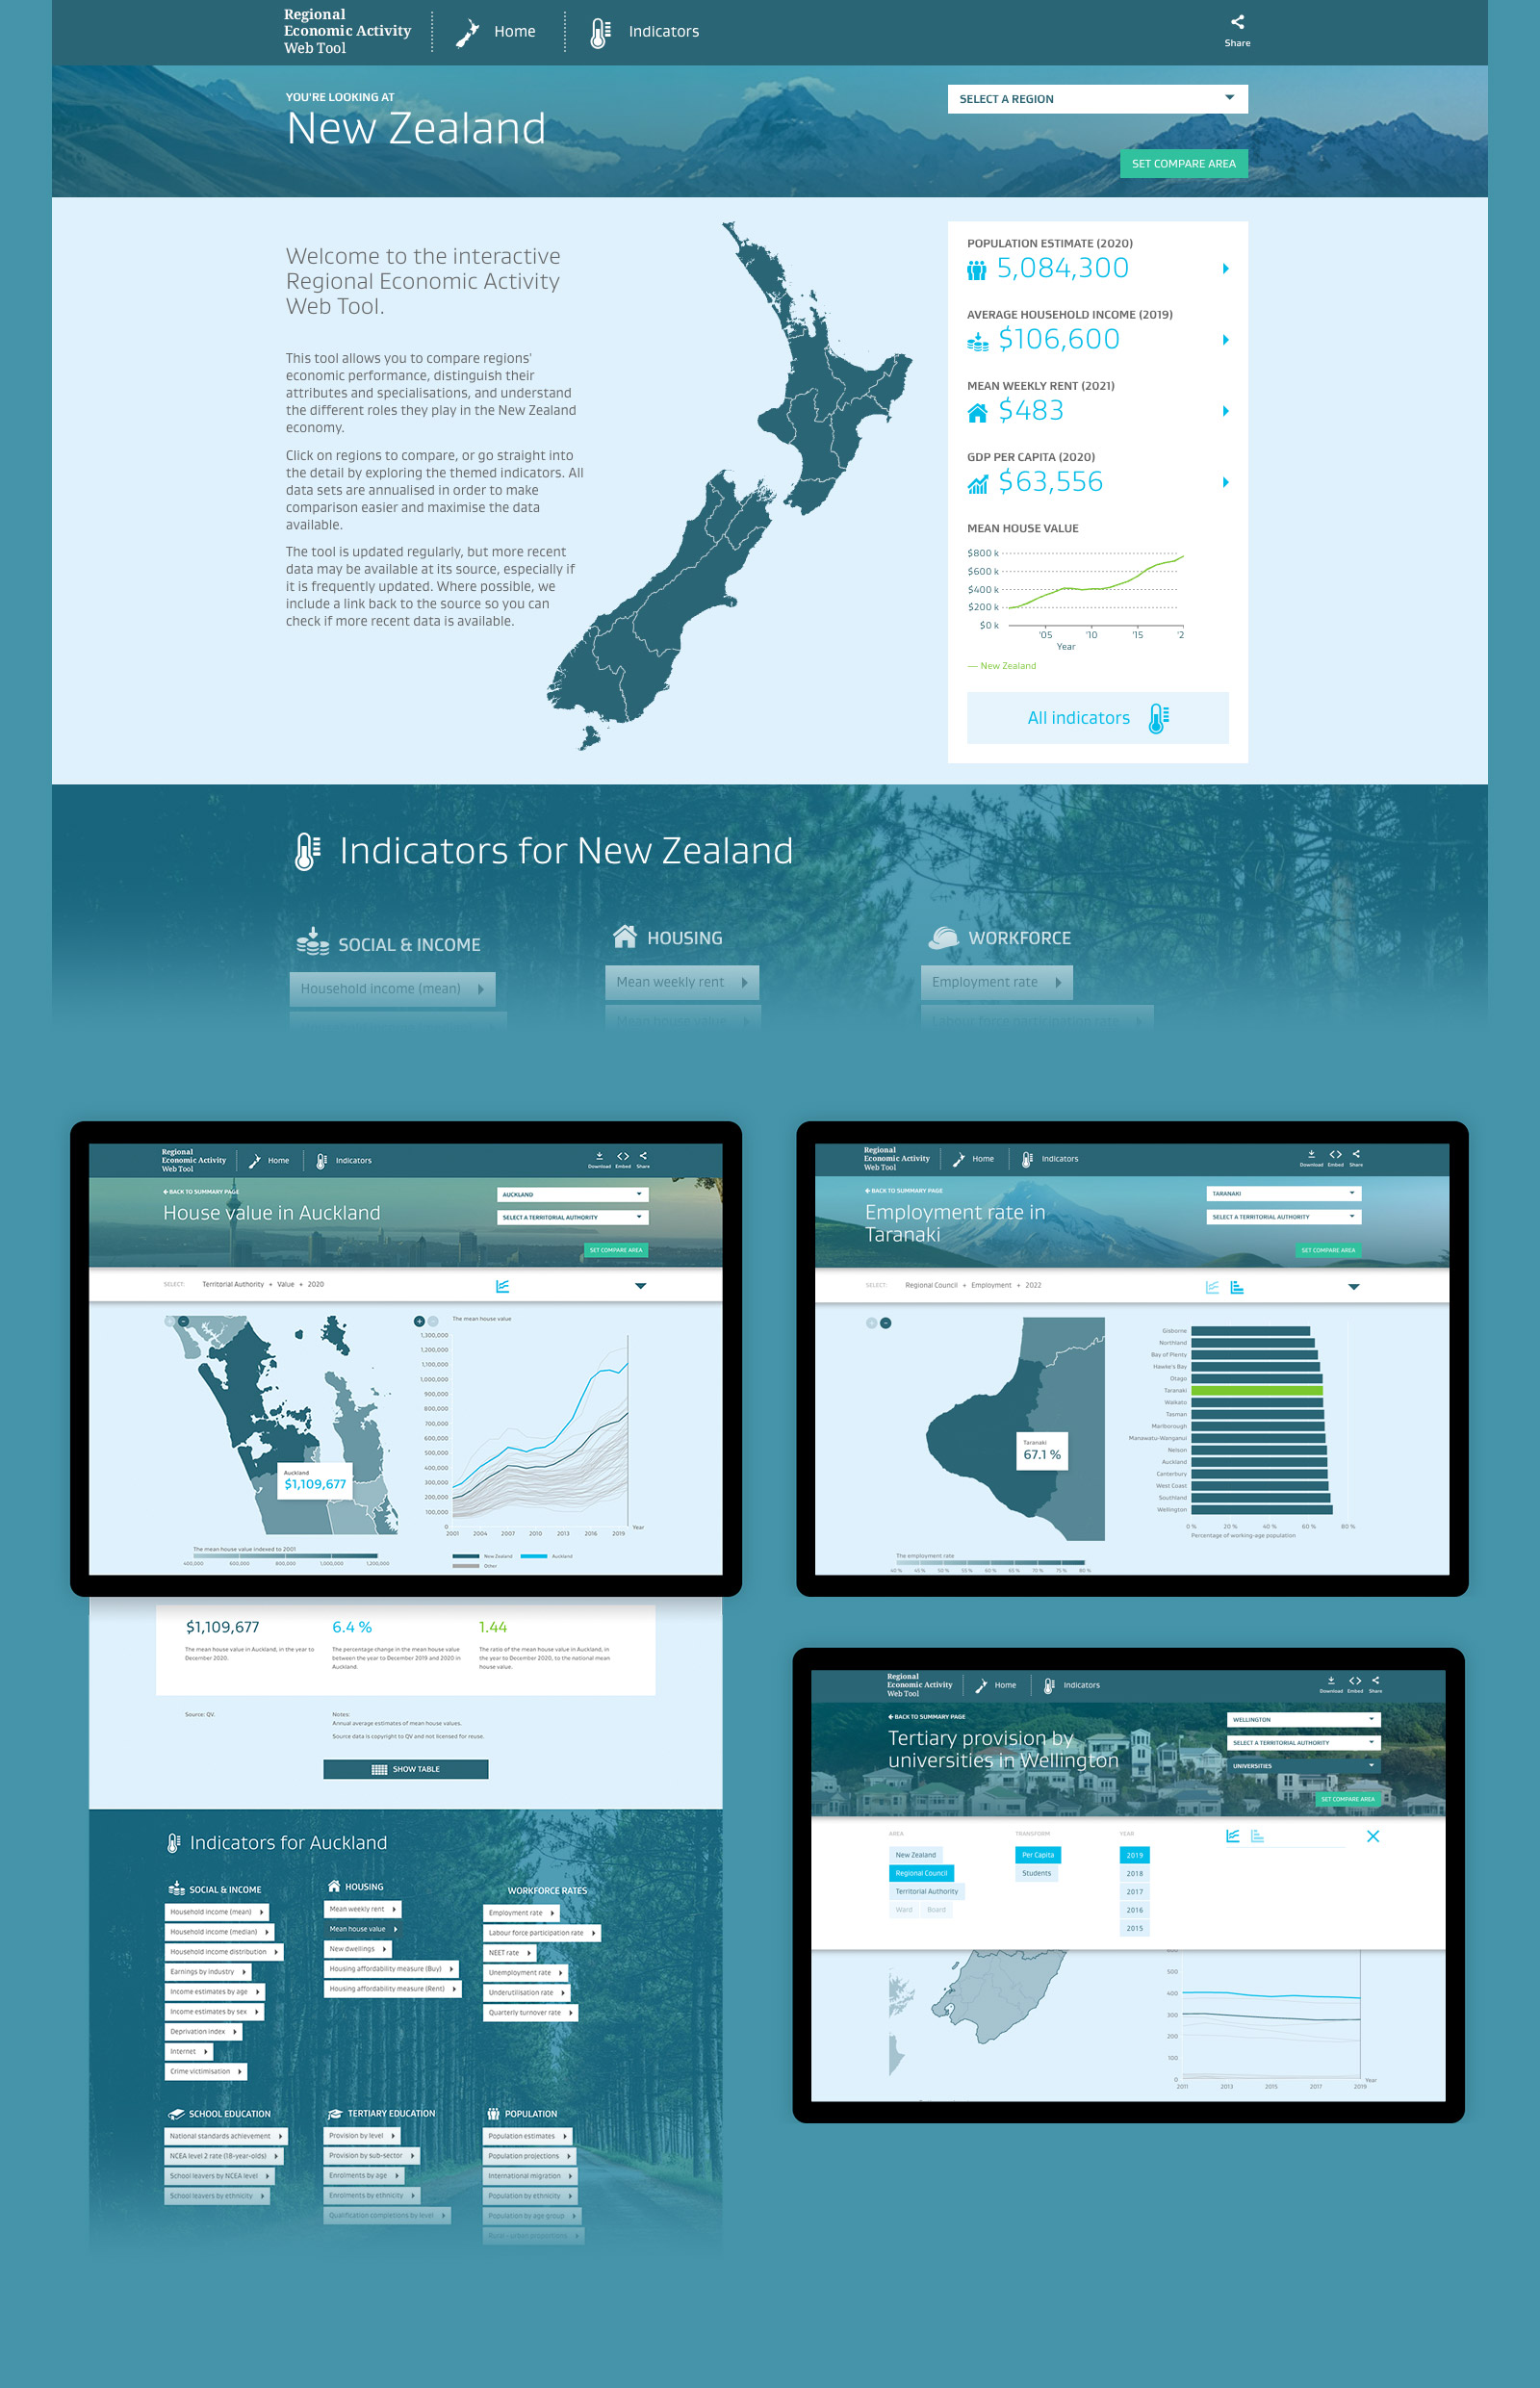
MBIE Regional Economic Activity Report
The New Zealand Regional Economic Activity tool, published by the Ministry of Business, Innovation and Employment (MBIE), allows users to explore and compare economic indicators across all regions of the country. Individual indicators, graphs and data sets can be embedded and downloaded, encouraging use by media and the wider public.
Client: Ministry of Business, Innovation and Employment
In partnership with Dragonfly Data Science
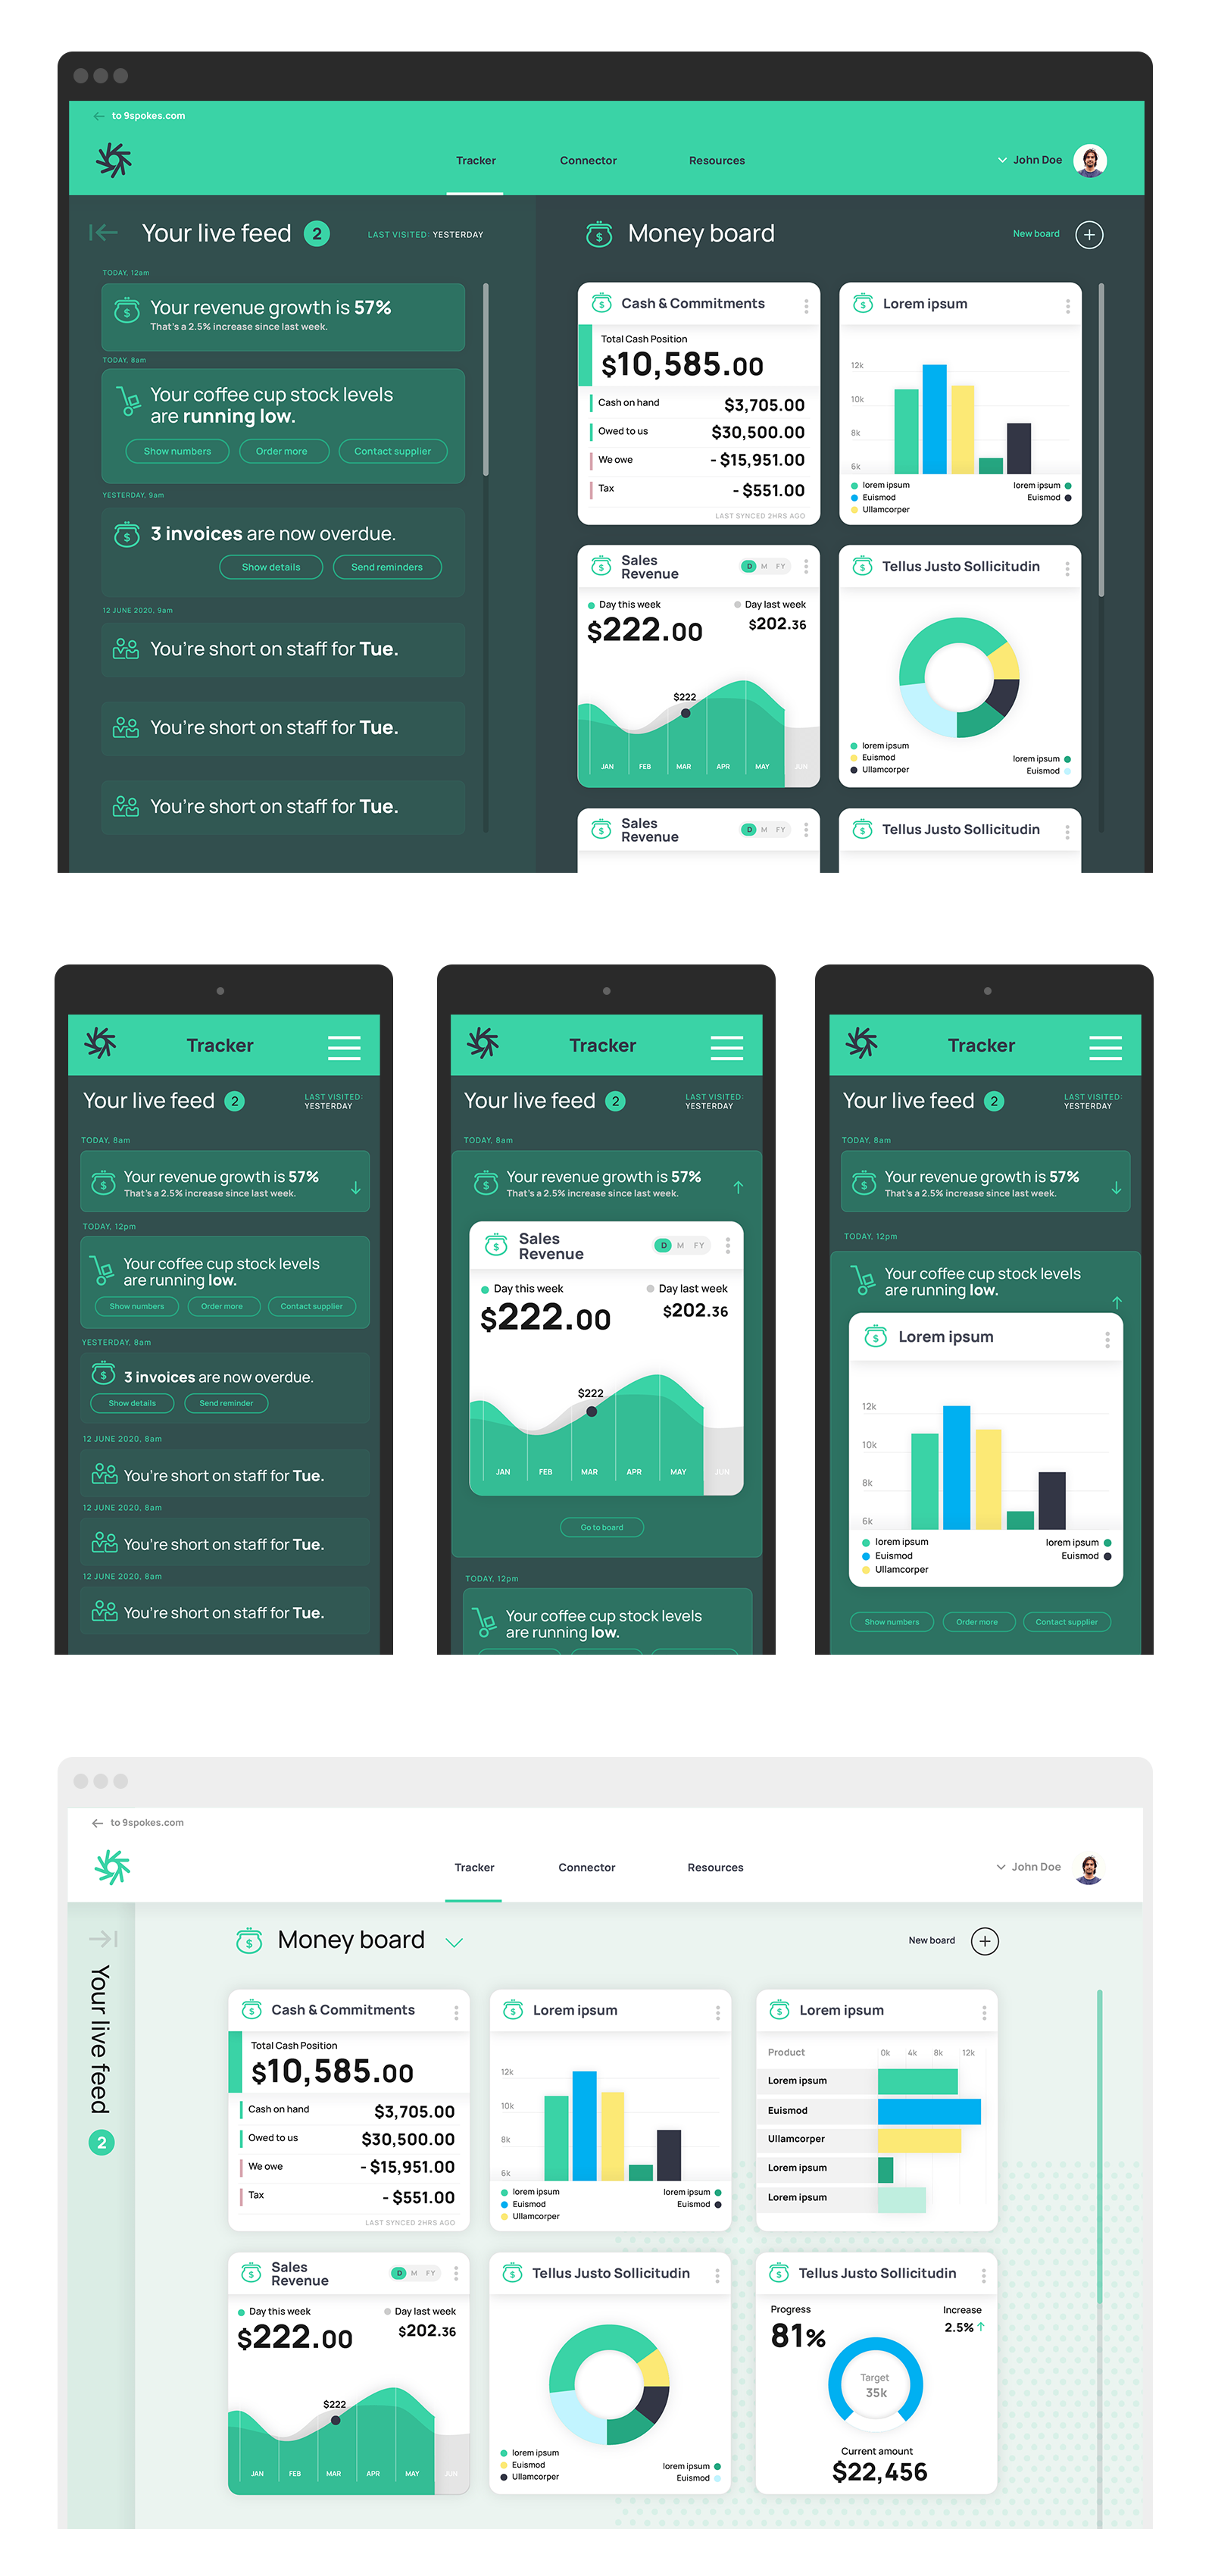
9Spokes Tracker
9Spokes' Business Hub is made up of the Tracker, Connector and Resource Center. At our core is the Tracker. A live feed powered by the apps and services businesses connect, the Tracker presents a 360-business view. Personalised notifications and alerts help monitor performance and flag where action’s required – be that more profitable staff deployment, or unsticking the supply chain.
Tiles provide a deep-dive into a business’ bank, financial and business metrics. They can be grouped into boards – think cash flow mapped out in one space.